Pandas is an open source Python package that is most widely used for data science/data analysis and machine learning tasks.

Install and import
To import pandas we usually import it with a shorter name since it's used so much:
Data Structures in Pandas
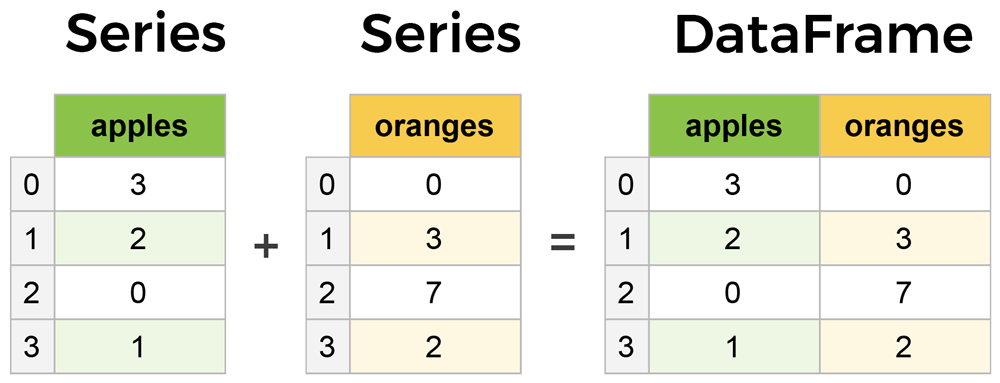
The primary two components of pandas are the Series and DataFrame.
A Series is essentially a column, and a DataFrame is a multi-dimensional table made up of a collection of Series.

It is possible to iterate over a DataFrame or Series as you would with a list, but doing so — especially on large datasets — is very slow.
An efficient alternative is to apply() a function to the dataset. For example, we could use a function to convert movies with an 8.0 or greater to a string value of "good" and the rest to "bad" and use this transformed values to create a new column.
First we would create a function that, when given a rating, determines if it's good or bad:
Now we want to send the entire rating column through this function, which is what apply() does:
>>> data["grade"]=data["marks"].apply(rating_function)
>>> data
names marks city grade
0 ram 90 chennai good
1 som 80 chennai bad
2 ravi 85 chennai good
Dataframe/Series.head() method
Pandas head() method is used to return top n (5 by default) rows of a data frame or series.
>>> data.head(2)
names marks city grade
0 ram 90 chennai good
1 som 80 chennai bad
Pandas Dataframe.describe() method
Pandas describe() is used to view some basic statistical details like percentile, mean, std etc. of a data frame or a series of numeric values.
>>> data.describe()
marks
count 3.0
mean 85.0
std 5.0
min 80.0
25% 82.5
50% 85.0
75% 87.5
max 90.0
DataFrames Concatenation
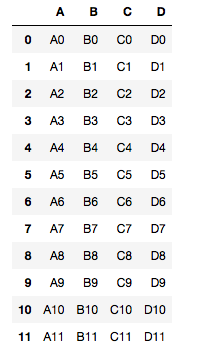
concat() function does all of the heavy lifting of performing concatenation operations along an axis while performing optional set logic (union or intersection) of the indexes (if any) on the other axes
Pandas GroupBy:
Groupby mainly refers to a process involving one or more of the following steps they are:
- Splitting : It is a process in which we split data into group by applying some conditions on datasets.
- Applying : It is a process in which we apply a function to each group independently
- Combining : It is a process in which we combine different datasets after applying groupby and results into a data structure


Comments
Post a Comment